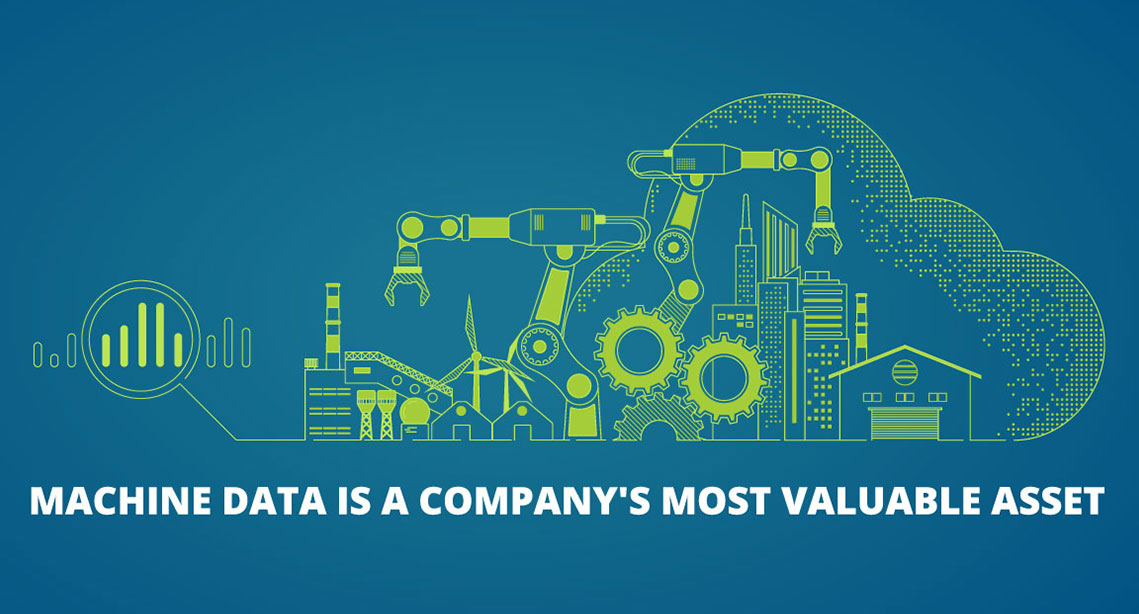
With Industry 4.0, it’s a brave new world. IoT and Industry 4.0 technologies are being used by System Builders to enhance their business and allow new value streams. System Builders maximise the efficiency of their products with IoT solutions and deliver innovative service packages to their customers. Your Most Valuable Asset is machine performance data.
Access to your machine data offers insight into real-time performance figures, rather than the traditional models engineers have developed to demonstrate how machines can perform. With historical research, you can guarantee continuous real-time tracking and monitoring of machine health, output status, and empowered decision-making. To determine parameters for each computer and allow for efficient preventive and predictive maintenance, engineers are then even better prepared.
Preventive And Predictive Maintenance
Preventive and predictive maintenance provides you with the ability to prevent or anticipate problems before they happen. This is also a competitive value-add that, as part of service packages, machine builders give customers. How do you collect the correct data and how do you use it in everyday operations to guide decisions? You have probably used the word ‘Overall Equipment Effectiveness’ (OEE) while talking about computer data collection. OEE is a commonly used metric or KPI of measurement and benchmarking used to measure how well manufacturing equipment performs concerning its maximum capacity. You guarantee that customer equipment is running at optimum speed and capability by analysing OEE on machines.
Optimize Machine Uptime
Analysis of the collected data will detect errors that lead up to failure if an unexpected problem happens. If it failed, service technicians may not have been present, may not be able to recognise what went wrong after the fact, or may simply not realise that the system was working outside its intended limits. Real-time data collection helps operators to implement countermeasures rapidly and mitigate threats in the future. To take this a step further, patterns that predict failures before seeing any real indicators are detected by correlating the data from one system with other installations of the same kind. This optimises the uptime of the system and lowers running costs, allowing you to determine where to invest in improvements on components that are repeatedly stopped while saving on elements that are historically robust.
Organize And Visualize The Data
Investing in a platform that provides intuitive tools to organise and visualise the data is the secret to high-quality analytics performance. There are resources that make designing personalised dashboards simple for your team, just by concentrating on what data points drive decision making in daily operations. Equipped with the analysis these dashboards offer, your team will actively strive for optimum results to maximise productivity and decrease downtime. The same instruments assist in historical research and record-keeping once this is perfected and recorded so that your company can continue to grow and identify best practises.

